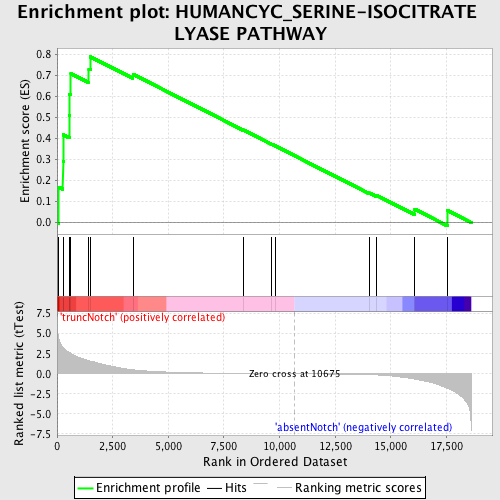
Profile of the Running ES Score & Positions of GeneSet Members on the Rank Ordered List
| Dataset | Set_03_absentNotch_versus_truncNotch.phenotype_absentNotch_versus_truncNotch.cls #truncNotch_versus_absentNotch |
| Phenotype | phenotype_absentNotch_versus_truncNotch.cls#truncNotch_versus_absentNotch |
| Upregulated in class | truncNotch |
| GeneSet | HUMANCYC_SERINE-ISOCITRATE LYASE PATHWAY |
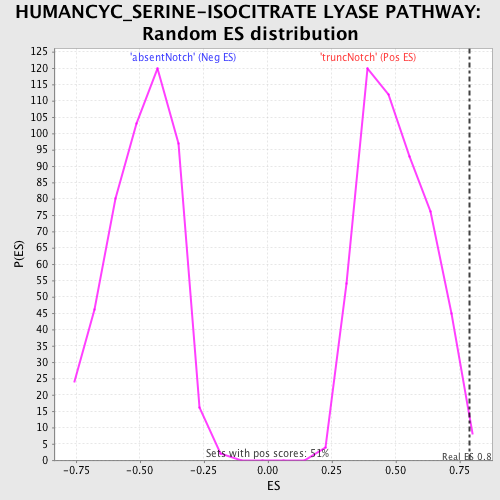
| Enrichment Score (ES) | 0.7885293 |
| Normalized Enrichment Score (NES) | 1.5814016 |
| Nominal p-value | 0.0078125 |
| FDR q-value | 0.28804228 |
| FWER p-Value | 0.919 |
| PROBE | DESCRIPTION (from dataset) | GENE SYMBOL | GENE_TITLE | RANK IN GENE LIST | RANK METRIC SCORE | RUNNING ES | CORE ENRICHMENT | |
|---|---|---|---|---|---|---|---|---|
| 1 | GRHPR | 1240193 | 74 | 4.350 | 0.1687 | Yes | ||
| 2 | ENO3 | 5270136 | 264 | 3.305 | 0.2897 | Yes | ||
| 3 | SHMT2 | 1850180 6040010 | 280 | 3.255 | 0.4181 | Yes | ||
| 4 | PGAM2 | 3610605 | 551 | 2.637 | 0.5083 | Yes | ||
| 5 | PGAM1 | 2570133 | 568 | 2.619 | 0.6114 | Yes | ||
| 6 | ENO1 | 5340128 | 621 | 2.530 | 0.7090 | Yes | ||
| 7 | SHMT1 | 5900132 | 1430 | 1.620 | 0.7299 | Yes | ||
| 8 | ACO1 | 50114 | 1499 | 1.570 | 0.7885 | Yes | ||
| 9 | MDH2 | 1850601 | 3411 | 0.501 | 0.7057 | No | ||
| 10 | AMAC1 | 940270 | 8368 | 0.042 | 0.4409 | No | ||
| 11 | BPGM | 5080520 | 9655 | 0.017 | 0.3724 | No | ||
| 12 | ENO2 | 2320068 | 9796 | 0.015 | 0.3655 | No | ||
| 13 | ST6GALNAC2 | 2680402 | 14048 | -0.108 | 0.1412 | No | ||
| 14 | MDH1 | 6660358 6760731 | 14373 | -0.141 | 0.1294 | No | ||
| 15 | CS | 5080600 | 16078 | -0.656 | 0.0638 | No | ||
| 16 | ACO2 | 4230600 | 17559 | -1.827 | 0.0568 | No |